Grid Mappings
See also
cf_xarray understands the concept of coordinate projections using the grid_mapping attribute convention. For example, the dataset might contain two sets of coordinates:
native coordinates in which the data is defined, e.g., regular 1D coordinates
projected coordinates which probably denote some “real” coordinates in latitude and longitude
Due to the projection, those real coordinates are probably 2D data variables. The grid_mapping attribute of a data variable makes a connection to another data variable defining the coordinate reference system (CRS) of those native coordinates. It should enable you to project the native coordinates into any other CRS, including the real 2D latitude and longitude coordinates. This is often useful for plotting, e.g., you can tell cartopy how to correctly plot coastlines for the CRS your data is defined in.
Extracting grid mapping info
To access grid_mapping attributes, consider this example:
%xmode minimal

import numpy as np

np.set_printoptions(threshold=10, edgeitems=2)

from cf_xarray.datasets import rotds

rotds
Exception reporting mode: Minimal
<xarray.Dataset> Size: 844B
Dimensions:       (rlon: 3, rlat: 3, bounds: 4)
Coordinates:
  * rlon          (rlon) float64 24B 17.93 18.05 18.16
  * rlat          (rlat) float64 24B 21.61 21.73 21.84
    lon           (rlon, rlat) float64 72B 64.22 64.42 64.63 ... 64.76 64.96
    lat           (rlon, rlat) float64 72B 66.64 66.58 66.52 ... 66.75 66.69
Dimensions without coordinates: bounds
Data variables:
    lon_bounds    (bounds, rlon, rlat) float64 288B 64.03 64.24 ... 64.74 64.95
    lat_bounds    (bounds, rlon, rlat) float64 288B 66.63 66.56 ... 66.83 66.76
    rotated_pole  int32 4B 0
temp (rlat, rlon) float64 72B 0.3614 0.9479 ... 0.8704 0.5141Dataset
The related grid mappings can be discovered using Dataset.cf.grid_mapping_names which maps a
“grid mapping name” to the
appropriate variable name:
rotds.cf.grid_mapping_names
{'rotated_latitude_longitude': ['rotated_pole']}
Access the grid_mapping variable as
rotds.cf["grid_mapping"]
<xarray.DataArray 'rotated_pole' ()> Size: 4B
array(0, dtype=int32)
Attributes:
grid_mapping_name: rotated_latitude_longitude
grid_north_pole_latitude: 39.25
grid_north_pole_longitude: -162.0DataArrays
Grid mapping variables are propagated when extracting DataArrays:
da = rotds.cf["temp"]
da
<xarray.DataArray 'temp' (rlat: 3, rlon: 3)> Size: 72B
array([[0.36136792, 0.94794539, 0.00870423],
       [0.99192025, 0.83213418, 0.39782446],
       [0.20403722, 0.87043044, 0.51406458]])
Coordinates:
* rlon (rlon) float64 24B 17.93 18.05 18.16
* rlat (rlat) float64 24B 21.61 21.73 21.84
rotated_pole int32 4B 0
Attributes:
standard_name: air_temperature
grid_mapping: rotated_poleTo find the grid mapping name use the singular DataArray.cf.grid_mapping_name
da.cf.grid_mapping_name
'rotated_latitude_longitude'
And to get the grid mapping variable
da.cf["grid_mapping"]
<xarray.DataArray 'rotated_pole' ()> Size: 4B
array(0, dtype=int32)
Attributes:
    grid_mapping_name:          rotated_latitude_longitude
    grid_north_pole_latitude:   39.25
grid_north_pole_longitude: -162.0Multiple grid mappings
A somewhat niche feature in CF is the ability to specify multiple grid mappings e.g. coordinate locations in multiple coordinate systems associated with the same data.
from cf_xarray.datasets import hrrrds

hrrrds.cf["foo"]
/tmp/ipykernel_1676/2712365793.py:3: UserWarning: Variables {'y', 'x'} not found in object but are referred to in the CF attributes.
  hrrrds.cf["foo"]
<xarray.DataArray 'foo' (x: 10, y: 20)> Size: 2kB
array([[  0,   1, ...,  18,  19],
       [ 20,  21, ...,  38,  39],
       ...,
       [160, 161, ..., 178, 179],
       [180, 181, ..., 198, 199]], shape=(10, 20))
Coordinates:
    latitude     (x, y) float64 2kB 1.0 1.0 1.0 1.0 1.0 ... 1.0 1.0 1.0 1.0 1.0
    longitude    (x, y) float64 2kB 0.0 0.0 0.0 0.0 0.0 ... 0.0 0.0 0.0 0.0 0.0
    x27700       (x, y) float64 2kB 0.0 0.0 0.0 0.0 0.0 ... 0.0 0.0 0.0 0.0 0.0
    y27700       (x, y) float64 2kB 1.0 1.0 1.0 1.0 1.0 ... 1.0 1.0 1.0 1.0 1.0
    spatial_ref  int64 8B 0
    crs_4326     int64 8B 0
    crs_27700    int64 8B 0
Dimensions without coordinates: x, y
Attributes:
grid_mapping: spatial_ref: x y crs_4326: latitude longitude crs_27700: x...This dataset has 3 grid mappings associated with the “foo” array.
Dataset
Use grid_mapping_names (note the plural) to get them all:
hrrrds.cf.grid_mapping_names
{'latitude_longitude': ['crs_4326'],
 'lambert_azimuthal_equal_area': ['spatial_ref'],
 'transverse_mercator': ['crs_27700']}
DataArray
Use grid_mapping_names (note the plural) to get them all:
hrrrds.foo.cf.grid_mapping_names
{'lambert_azimuthal_equal_area': ['spatial_ref'],
 'latitude_longitude': ['crs_4326'],
 'transverse_mercator': ['crs_27700']}
Simply asking for one will raise an error
hrrrds.foo.cf.grid_mapping_name
ValueError: Multiple grid mappings found: ['spatial_ref', 'crs_4326', 'crs_27700']. Please use DataArray.cf.grid_mapping_names instead.
All grid mapping variables and coordinate variables are in the “associated variable names” for that array:
hrrrds.cf.get_associated_variable_names("foo")
/tmp/ipykernel_1676/2470872243.py:1: UserWarning: Variables {'y', 'x'} not found in object but are referred to in the CF attributes.
  hrrrds.cf.get_associated_variable_names("foo")
{'ancillary_variables': [],
 'cell_measures': [],
 'coordinates': ['latitude', 'longitude', 'x27700', 'y27700'],
 'bounds': [],
 'grid_mapping': ['spatial_ref', 'crs_4326', 'crs_27700'],
 'grid': [],
 'mesh': [],
 'geometry': []}
GridMapping structure
A richer data structure GridMapping is also available:
hrrrds.foo.cf.grid_mappings
(GridMapping(name='lambert_azimuthal_equal_area', crs=<CRS: EPSG:3035>, array=<DataArray 'spatial_ref' ()>, coordinates=('x', 'y')),
 GridMapping(name='latitude_longitude', crs=<CRS: EPSG:4326>, array=<DataArray 'crs_4326' ()>, coordinates=('latitude', 'longitude')),
 GridMapping(name='transverse_mercator', crs=<CRS: EPSG:27700>, array=<DataArray 'crs_27700' ()>, coordinates=('x27700', 'y27700')))
The ordering of this tuple matches that of the grid_mapping attribute
grid = next(iter(hrrrds.foo.cf.grid_mappings))
grid
GridMapping(name='lambert_azimuthal_equal_area', crs=<CRS: EPSG:3035>, array=<DataArray 'spatial_ref' ()>, coordinates=('x', 'y'))
The grid mapping DataArray can be extracted
grid.array
<xarray.DataArray 'spatial_ref' ()> Size: 8B
array(0)
Attributes: (12/15)
    crs_wkt:                         PROJCRS["ETRS89-extended / LAEA Europe",...
    semi_major_axis:                 6378137.0
    semi_minor_axis:                 6356752.314140356
    inverse_flattening:              298.257222101
    reference_ellipsoid_name:        GRS 1980
    longitude_of_prime_meridian:     0.0
    ...                              ...
    projected_crs_name:              ETRS89-extended / LAEA Europe
    grid_mapping_name:               lambert_azimuthal_equal_area
    latitude_of_projection_origin:   52.0
    longitude_of_projection_origin:  10.0
    false_easting:                   4321000.0
false_northing: 3210000.0Use grid_mapping in projections
pyproj
The grid mapping information use very useful in projections, e.g., for plotting. pyproj understands CF conventions right away, e.g.
from pyproj import CRS

CRS.from_cf(rotds.cf["grid_mapping"].attrs)
<Derived Geographic 2D CRS: {"$schema": "https://proj.org/schemas/v0.2/projjso ...>
Name: undefined
Axis Info [ellipsoidal]:
- lon[east]: Longitude (degree)
- lat[north]: Latitude (degree)
Area of Use:
- undefined
Coordinate Operation:
- name: Pole rotation (netCDF CF convention)
- method: Pole rotation (netCDF CF convention)
Datum: World Geodetic System 1984 ensemble
- Ellipsoid: WGS 84
- Prime Meridian: Greenwich
Alternatively use the GridMapping object
grid = next(iter(rotds.cf.grid_mappings))  # there's only one, so extract it
grid.crs
<Derived Geographic 2D CRS: {"$schema": "https://proj.org/schemas/v0.2/projjso ...>
Name: undefined
Axis Info [ellipsoidal]:
- lon[east]: Longitude (degree)
- lat[north]: Latitude (degree)
Area of Use:
- undefined
Coordinate Operation:
- name: Pole rotation (netCDF CF convention)
- method: Pole rotation (netCDF CF convention)
Datum: World Geodetic System 1984 ensemble
- Ellipsoid: WGS 84
- Prime Meridian: Greenwich
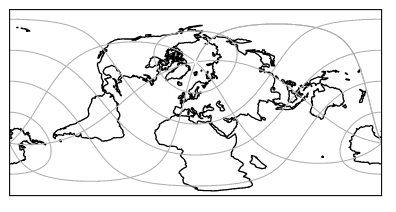
cartopy
For use in cartopy, there is some more overhead due to this issue. So you should select the right cartopy CRS and just feed in the grid mapping info:
from cartopy import crs as ccrs

grid_mapping = rotds.cf["grid_mapping"]
pole_latitude = grid_mapping.grid_north_pole_latitude
pole_longitude = grid_mapping.grid_north_pole_longitude

ccrs.RotatedPole(pole_longitude, pole_latitude)